Update: The original version used the grit gem which is now deprecated. I’ve updated the scripts to use rugged which are the offical ruby bindings for libgit2.
Many people have been asking me for the scripts I use to generate diagrams of git repositories which I use during my trainings.
It’s a bunch of quick and dirty ruby scripts (my first ruby programs I
think) which walk the repo and output dot programs that are then
converted into png files and displayed using qiv.
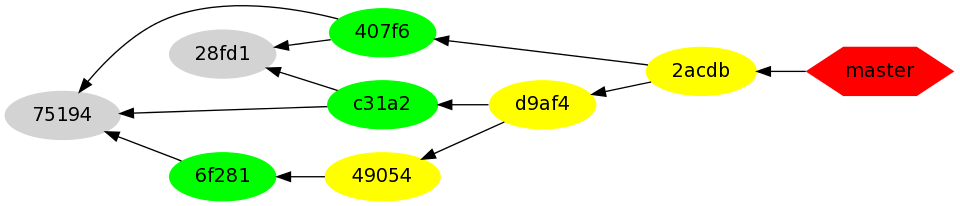
There are two of them. There’s a showdag.rb which tries to draw the
DAG of the current repo. It will draw the branch markers as well as
the commits, trees and blobs. I’ve found it useful to describe how the
DAG grows over time. There’s a second called showrepo.rb which is
really just a graphical git log --graph kind of thing. I often use
it to show people the difference between merging and rebasing and how
these operations affect the DAG. There are also two shell functions
which call the ruby scripts and then use dot to generate the images
and then call qiv to display them. They’re run by executing showdag
. or showrepo . at the top level of the repository you’re in.
Here’s the code.
blog comments powered by Disqus